What Price Tracking Tools Actually Do
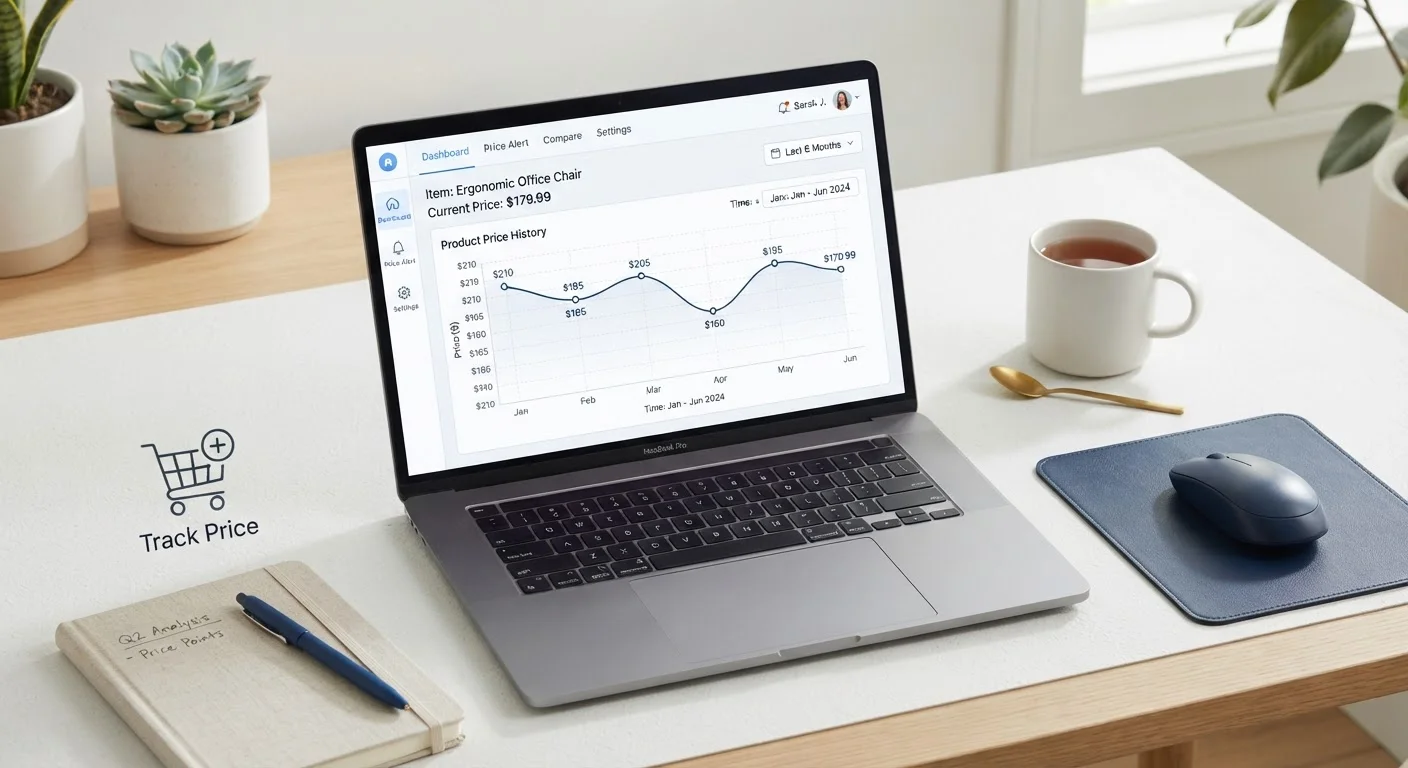
Price tracking tools are browser extensions, websites, or app-based services that automatically record the listed price of a product at a given retailer on a regular basis - sometimes multiple times per day. Over weeks and months, those data points accumulate into a price history graph you can consult before buying.
The underlying mechanism is web scraping: automated software visits a product page, reads the displayed price, and logs it with a timestamp. When you look up an item, you see that logged history rendered as a chart. Some tools also let you set a target price and receive an email or push notification when the item drops to that level.
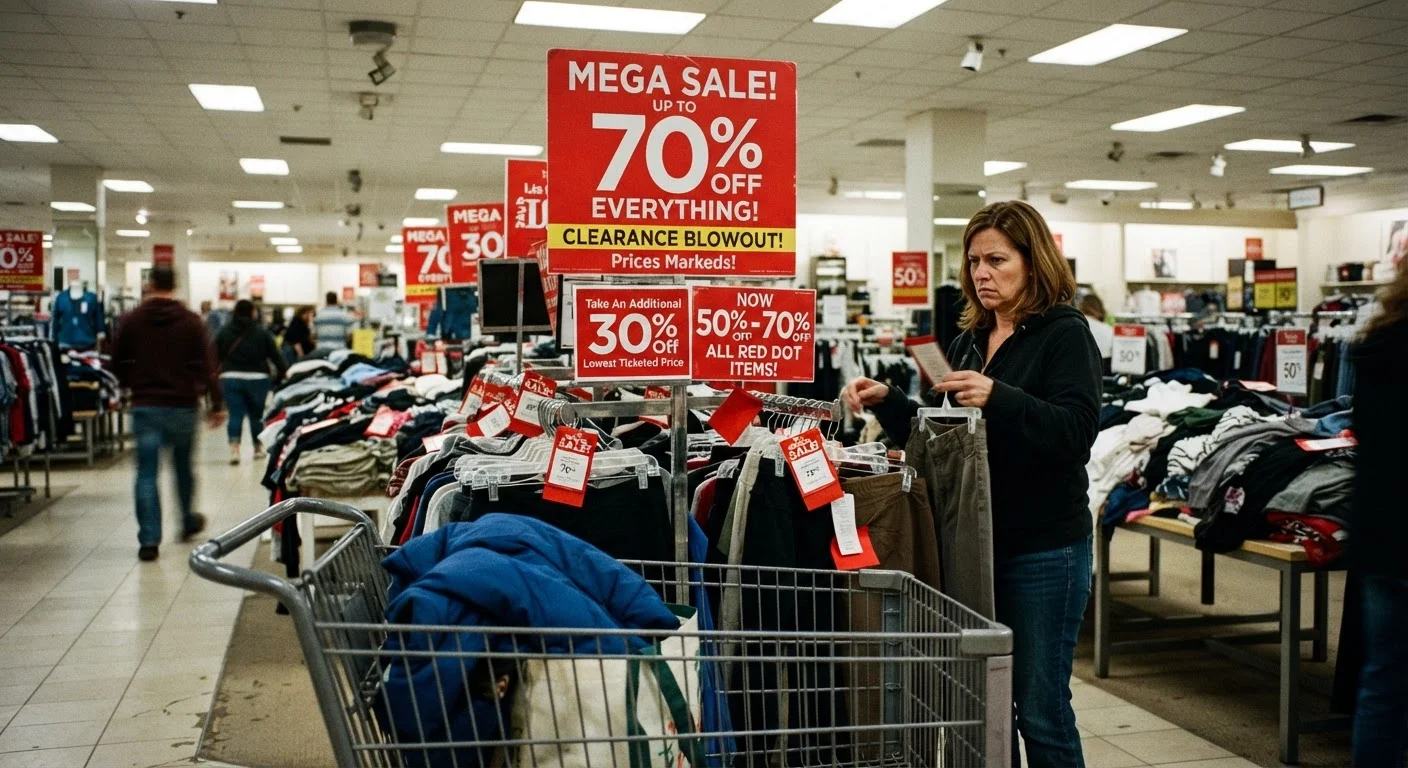
This matters because retailers change prices far more frequently than most shoppers realize. A product page might cycle through a dozen different price points in a single month. Without a historical record, there's no way to know whether today's "40% off" badge reflects a genuine reduction or simply a return to the price the item sold at for most of the year. As our editorial on why sale prices don't always mean savings explains, pricing psychology is deliberately designed to make discounts feel larger than they are.
More History Is Almost Always Better
When evaluating a price chart, prioritize tools that offer at least six months of data. Short windows can make a temporarily inflated price look like a legitimate baseline, skewing your read of the current discount. If a tracker only shows 30 days of history for a product that's been on the market for years, look for a second source.
Where Price Trackers Fall Short
Understanding the limits of these tools is just as important as knowing how to use them.
- They only capture the public listed price. Member-only prices, credit card portal rates, loyalty-program discounts, and cart-level coupons are rarely tracked. The "history" you see may not reflect the true price paid by savvy shoppers.
- Marketplace complexity. On large retail platforms, the same product listing may be fulfilled by multiple sellers at different prices. A tracker logging the "lowest available" price at any given moment can produce a history that's hard to interpret because you're not comparing apples to apples.
- Artificially inflated baselines. Some retailers temporarily raise a price before a promotional event so the subsequent markdown looks dramatic. If the tracker's history only goes back a few weeks, it may show a steep drop - but that drop is from a manufactured high. Our piece on how inflated original prices mislead shoppers covers this tactic in depth.
- Data gaps and scraping delays. Scrapers can miss price windows, hit access errors, or update less frequently than prices actually change. A tracker showing no recent movement doesn't necessarily mean the price has been stable.
- Product version changes. A product refreshed with new specifications may share the same URL as the old version. The historical price data then blends two different products, making comparisons meaningless.
For context on evaluating what actually makes a price worth paying beyond the raw number, see The Anatomy of a Good Deal.
How to Use Price History Data Effectively
What you will need
Follow these steps to get a clearer picture before committing to a purchase.
Look up the product's price history before reading the sale badge
Navigate to a price tracking site or activate a browser extension while viewing the product page. Pull up the full price history chart - ideally going back at least 90 days, and preferably 6-12 months for higher-ticket items. Read the chart before you read the retailer's discount messaging.
Check whether the 'original' price appears in the tracker's history
Find the price the retailer lists as the original or "was" price. Then locate that same price point on the history chart. If the item rarely or never sold at that reference price, the discount percentage is being measured against a figure that wasn't a real market price.
Identify the item's typical price range
Rather than focusing on a single data point, note the floor (lowest recorded price) and the ceiling (highest). Ask whether today's price sits in the lower third of that range. If it does, the deal may be genuine. If it sits in the middle or upper range, the sale label is doing more marketing work than the actual discount.
Cross-check against prices unavailable to the tracker
Search for the same item using your credit card's shopping portal, any applicable loyalty programs, or cash-back platforms. These prices typically don't appear in historical tracking data. The combination of a favorable price history plus an additional stackable discount is when a purchase genuinely earns the label of a good deal.
Verify the listing is for the same product version
Check the product model number, specifications, and seller name against what the tracker has been logging. If the item was recently updated or a marketplace listing switched primary sellers, the historical data may reflect a different configuration. Confirm you're comparing like for like before drawing any conclusions.
Putting It All Together
Price tracking data is a useful input, not a verdict. A long price history showing today's price is genuinely at or near a multi-month low is meaningful evidence. A short history, a suspiciously timed spike before the sale, or a tracker that doesn't account for seller variation should all raise your skepticism.
Tools like these work best when paired with broader research habits - checking multiple sources, understanding return policies, and knowing what a product is actually worth to you. For a complementary perspective on how deal aggregator sites compile and vet discounts, see how deal aggregator sites work and when to trust them.
The goal isn't to squeeze every last cent out of every transaction. It's to avoid paying meaningfully more than a product is worth - or falling for a promotion that isn't one.